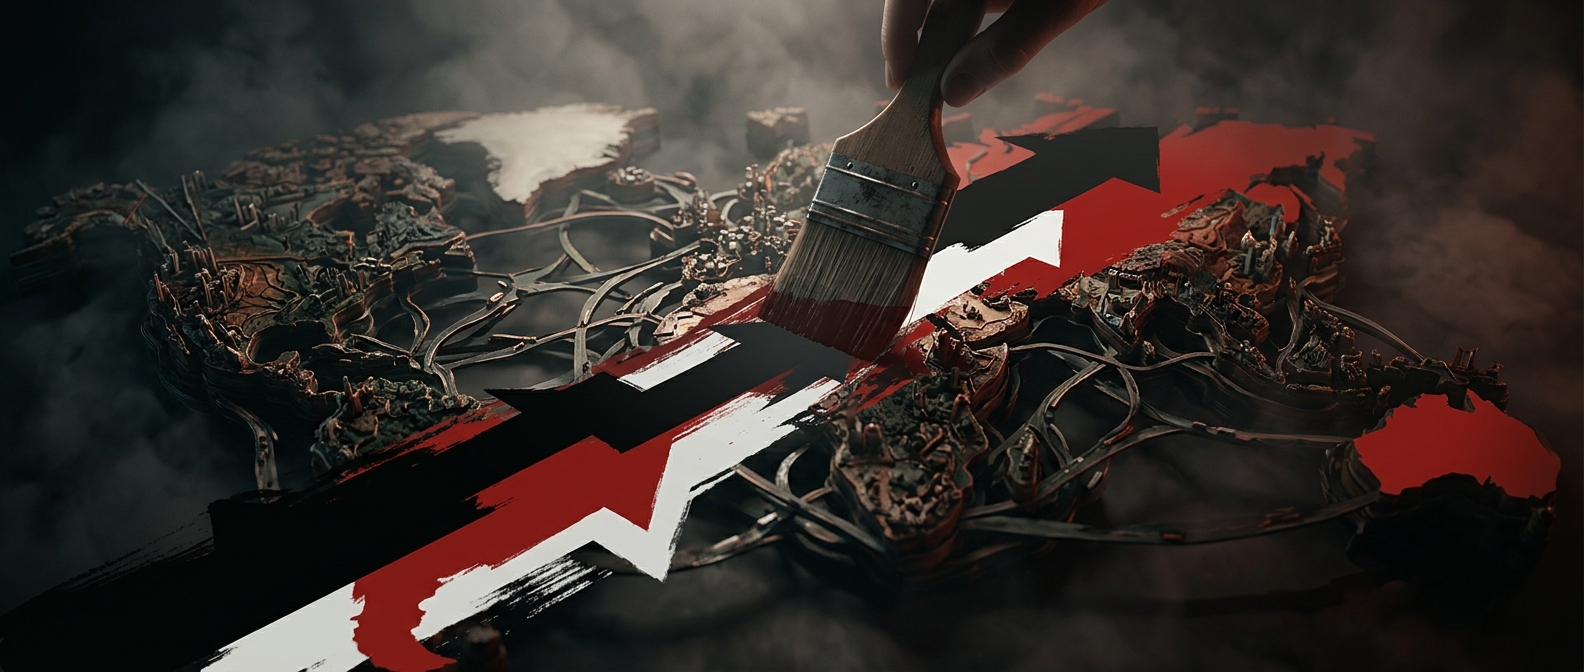
How a conflict becomes a sequence of slides
A conflict rarely has one beginning, one cause, or a clean set of sides. Political movements split, alliances shift, and events that look decisive in hindsight may have seemed uncertain at the time. An infographic has to turn that tangled history into a path a reader can follow: a few dates, actors, arrows, and labels.
That compression is not neutral. Choosing a starting point can make earlier grievances disappear; grouping several factions under one name can make them seem more unified than they are. A timeline may show that one event came before another without showing whether it caused it. Even a map simplifies: borders and shaded areas suggest stable control, though authority on the ground can be disputed or change quickly.
Why the simplified version travels
A small graphic is easy to scan on a phone and easy to repost without the explanation that originally accompanied it. Pastel colors, short captions, and a clear sequence reduce the effort needed to understand the basic outline. They also make a complicated story feel settled: the viewer sees a polished chain of events, not the uncertainty, competing accounts, or missing evidence behind each choice.
The format can still orient readers. Its strongest use is as a doorway into a subject, not a substitute for its history. A useful graphic makes its scope clear—what years, places, and actors it includes—and signals where the account is simplified. Without that framing, omission can do as much interpretive work as the facts shown.
Read the gaps as well as the arrows
When a graphic presents a conflict as a tidy progression, ask what its first slide leaves out, whose perspective is absent, and whether the arrows show chronology or claim causation. Those questions do not require dismissing the graphic; they reveal what its limited space has forced it to decide. The most consequential detail may be not what fits on the slide, but what the slide makes easy to forget.