Turning the atmosphere into a grid of arithmetic
A weather map looks continuous, but a forecast has to be calculated from a manageable set of measurements. Early numerical forecasters divided the atmosphere into a grid: at each point, they tracked quantities such as air pressure and wind, then used equations describing how moving air changes those quantities over time.
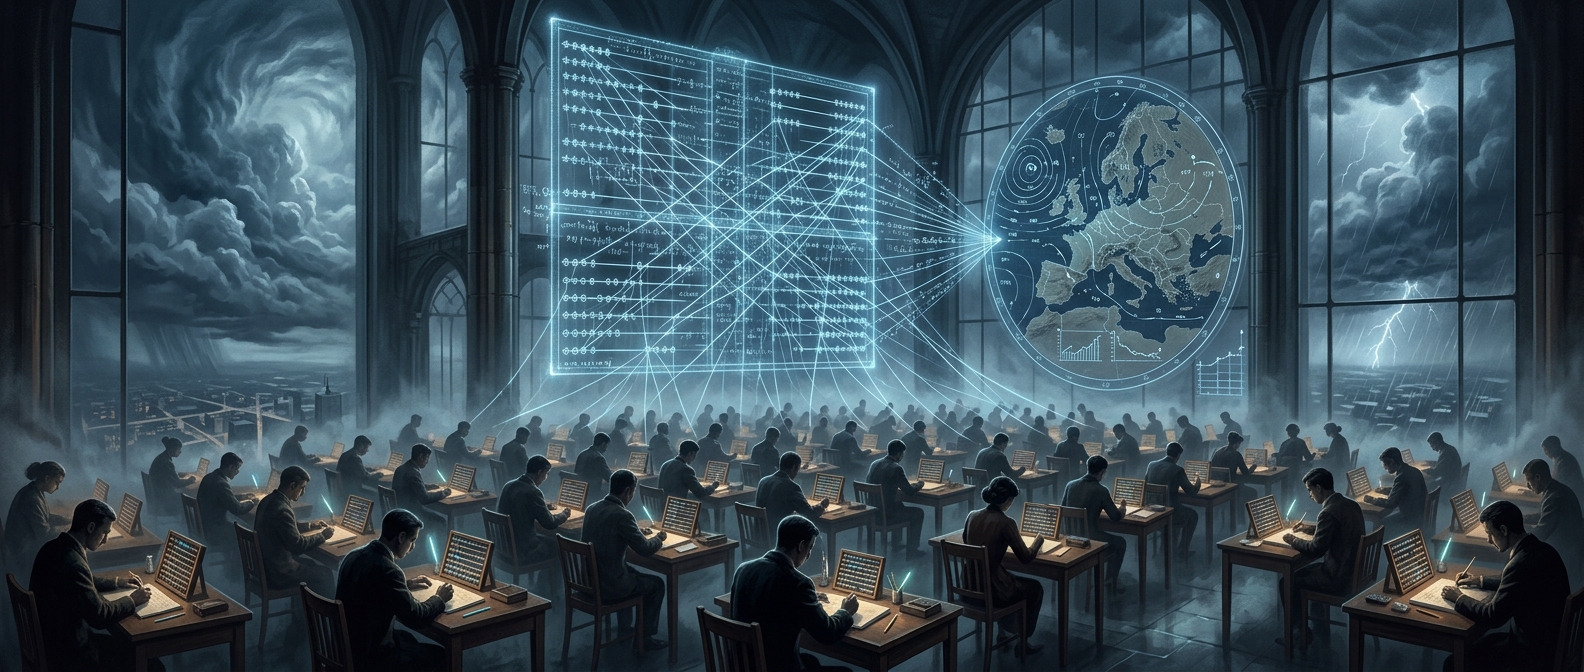
The equations could not be solved all at once by hand. Instead, teams of human “computers”—people doing calculations as their job—handled separate pieces. One worker might calculate how pressure changes at a grid point; another could work on a neighboring point or a later step. Results were passed along so the calculations could be combined into a picture of how a weather system would move.
A forecast was also a coordination problem
The work depended on more than arithmetic. Every person needed the same starting observations, grid conventions, and calculation sequence. A small mistake or delay in one part could affect later steps, while the atmosphere kept changing during the many hours or days required to finish the hand calculations.
That made the method physically possible but painfully slow. The forecast’s useful window could pass before the computation was complete. The labor also showed why numerical forecasting was a natural task for electronic computers: they could repeat the same operations rapidly and consistently across many grid points, updating the whole atmospheric picture in step.
The striking idea was not simply that people could calculate the weather. It was that a forecast could be organized like a production line—many small calculations, coordinated into one prediction of a moving storm.