Turning a Light Curve Into a Listening Experience
A telescope does not record a star’s sound. It measures how much light reaches it over time. Plot those measurements in order and the result is a light curve: a record of when the star appears brighter or dimmer.
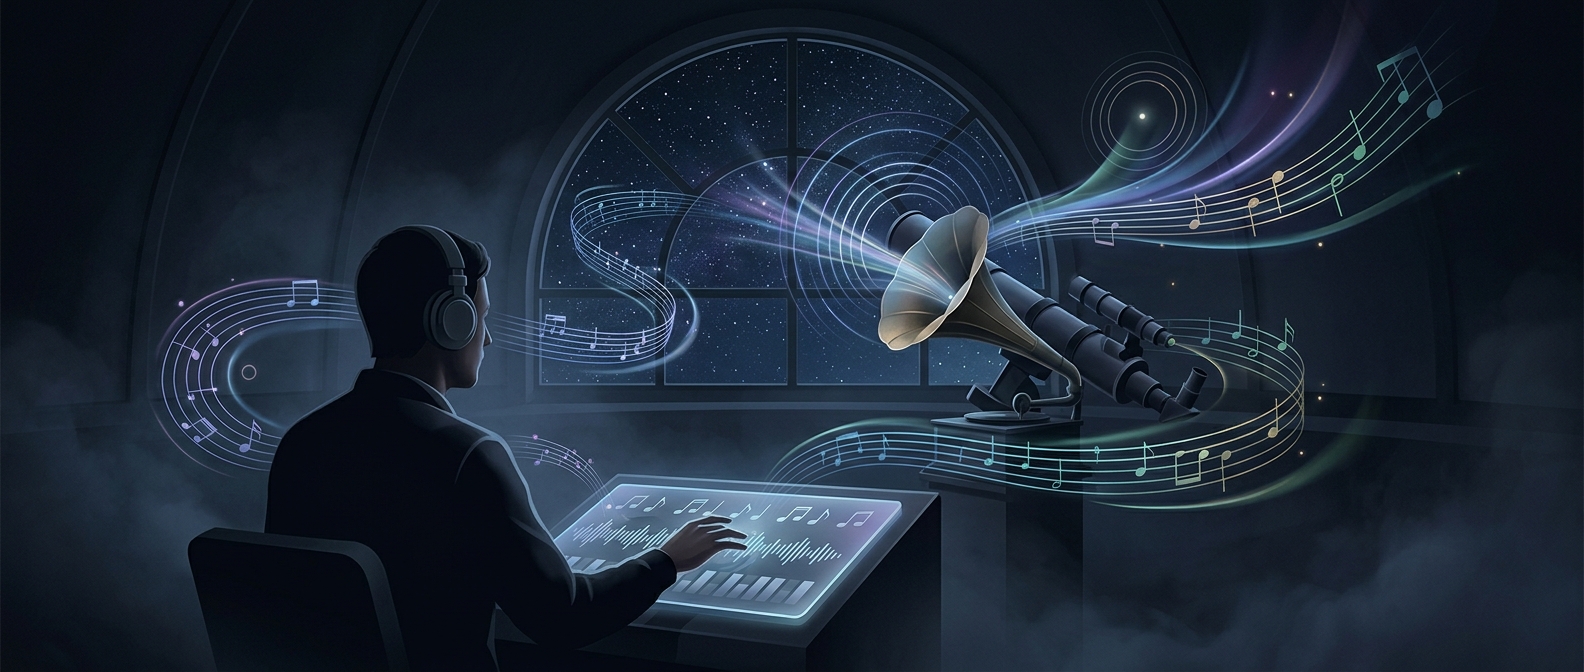
Sonification gives that record an audible form. A designer chooses a rule for translating the measurements—for example, making brighter readings produce higher notes, or making each measurement a beat whose volume reflects the light level. The resulting sound is an interpretation of the data, not a recording of something traveling from the star to a listener.
What the Ear Can Help Reveal
When brightness changes are mapped to sound, a steady pattern may become a repeating pulse, while a sudden dip can stand out as a change in pitch or rhythm. Those changes can prompt questions about what is happening in the data, just as a visual graph can. The exact sound depends on the mapping: changing the rule can make the same measurements easier or harder to hear.
For a blind astronomer, this offers a way to examine astronomical data without relying on a visual display. It can also give sighted researchers another way to explore a pattern, though it does not replace the measurements or the analysis needed to interpret them. The star remains silent in this process; what becomes audible is the changing shape of its light.